Ocellus XR · Urban Systems Lab
Visualizing Climate Equity in NYC
About Ocellus
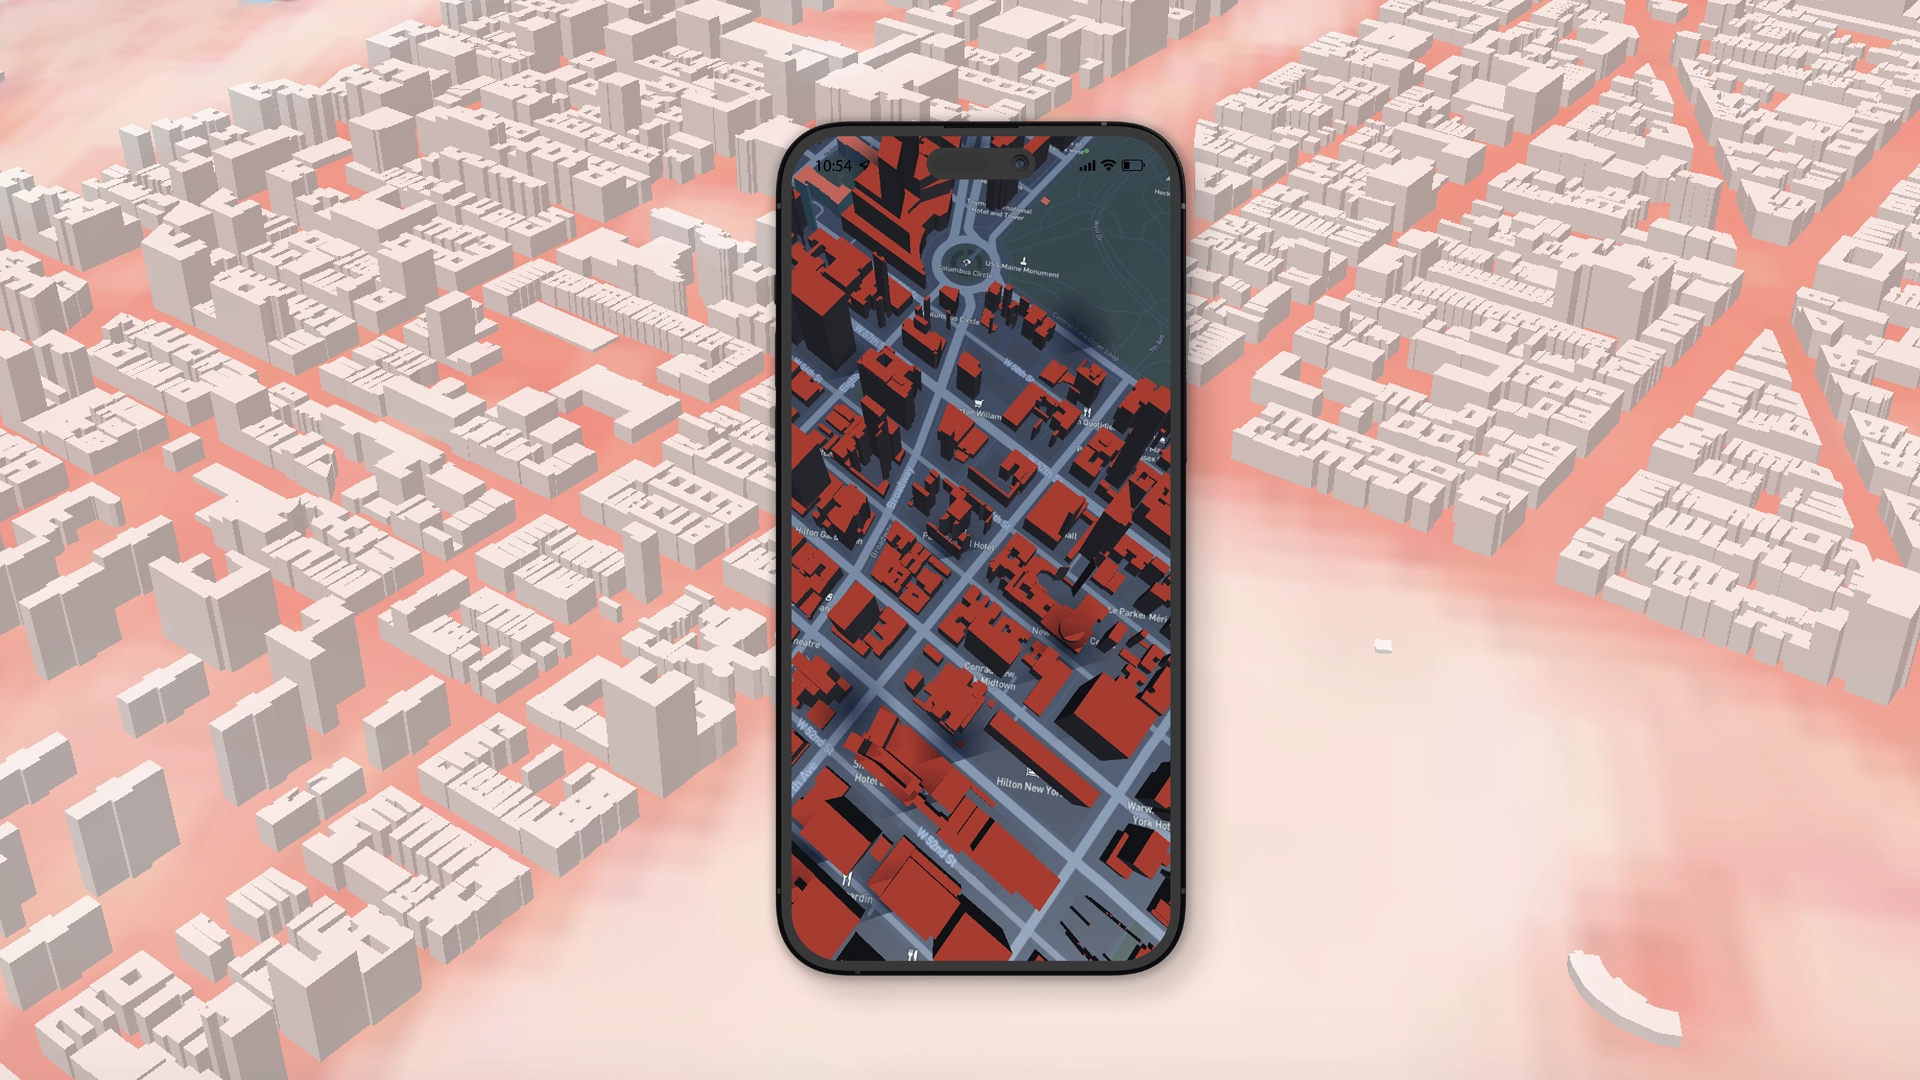
Ocellus is a mixed reality platform that leverages the Urban Systems Lab's Data Visualization Platform to present users with unique interactive geospatial maps of heat, flood risk, and other climate indicators in New York City. The project aims to improve understanding of urban systems and enhance decision-making for more equitable and resilient cities.
OneNYC 2050
The project is grounded in New York City's long-term strategic plan, OneNYC 2050; a framework that addresses the city's most pressing infrastructure, environmental, and socioeconomic challenges through an equity lens. Ocellus brings that data to life in a spatial, immersive format that allows communities, planners, and policymakers to engage with it directly.
Research & Narrative Design
I conducted research to identify infrastructure, environmental, and socioeconomic equity issues related to OneNYC 2050. I co-authored narratives across three thematic areas that form the backbone of the platform's storytelling layer:
Additionally, I assisted the team in storyboarding, wireframing, and prototyping the user interface and user experience of the mobile application that visualizes the narratives, infographics, and geospatial maps.
Equity Research
Exposure; Heat & Flood Risk
Mapping where climate hazards are most acute across New York City's neighborhoods, drawing on data sources including the Urban Heat Island index, FEMA flood maps, and historical storm surge records.


Vulnerability; Social & Demographic
Identifying which communities are least equipped to absorb climate impacts based on factors such as income, housing quality, health outcomes, and access to green space.
Investment & Equity; Green Infrastructure
Examining where climate investments and green infrastructure resources are being directed, and whether the distribution aligns with vulnerability and need across the five boroughs.
UX Design & Prototyping
Storyboarding
I helped the team translate the research narratives into spatial storytelling flows; mapping how a user would move through the mixed reality experience, from the opening context to the layered data views for each thematic narrative.

Wireframing
Low-fidelity wireframes established the core layout of the mobile interface, defining how users navigate between narratives, interact with geospatial layers, and access supplementary infographics and data.


Prototyping
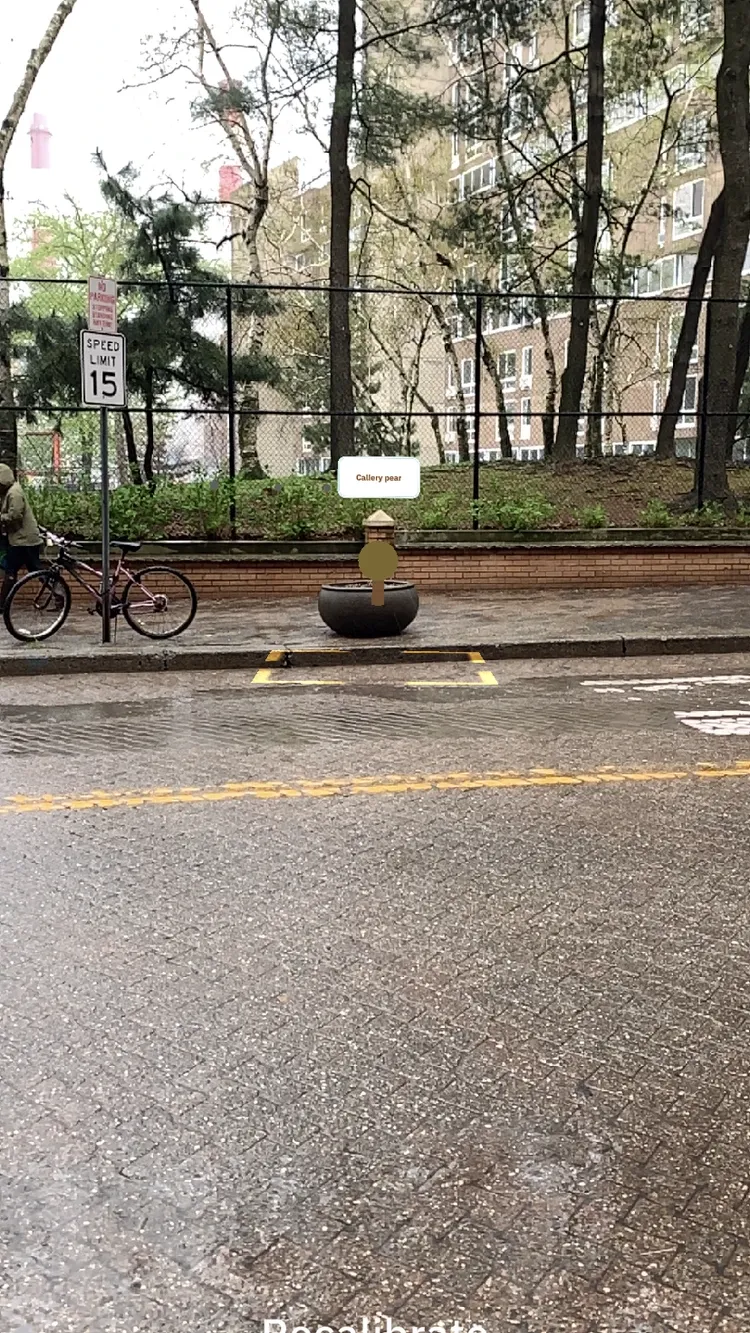
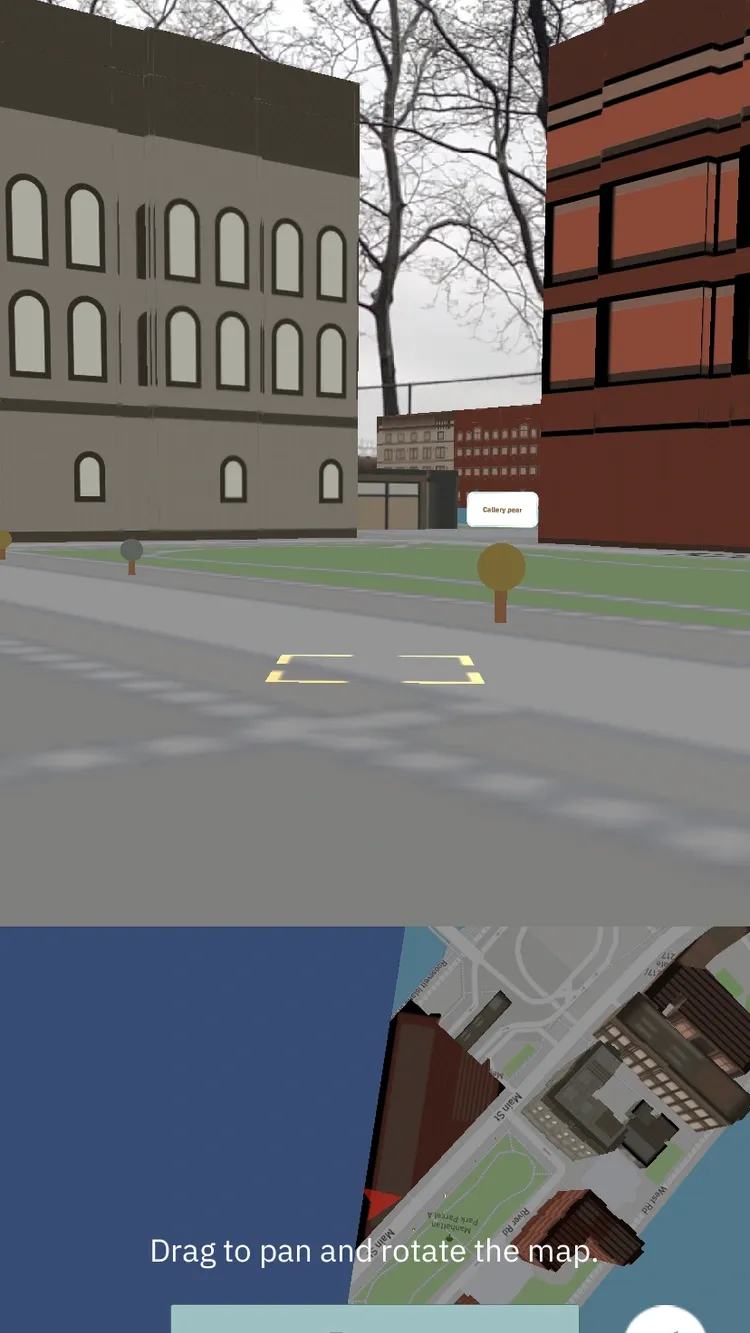
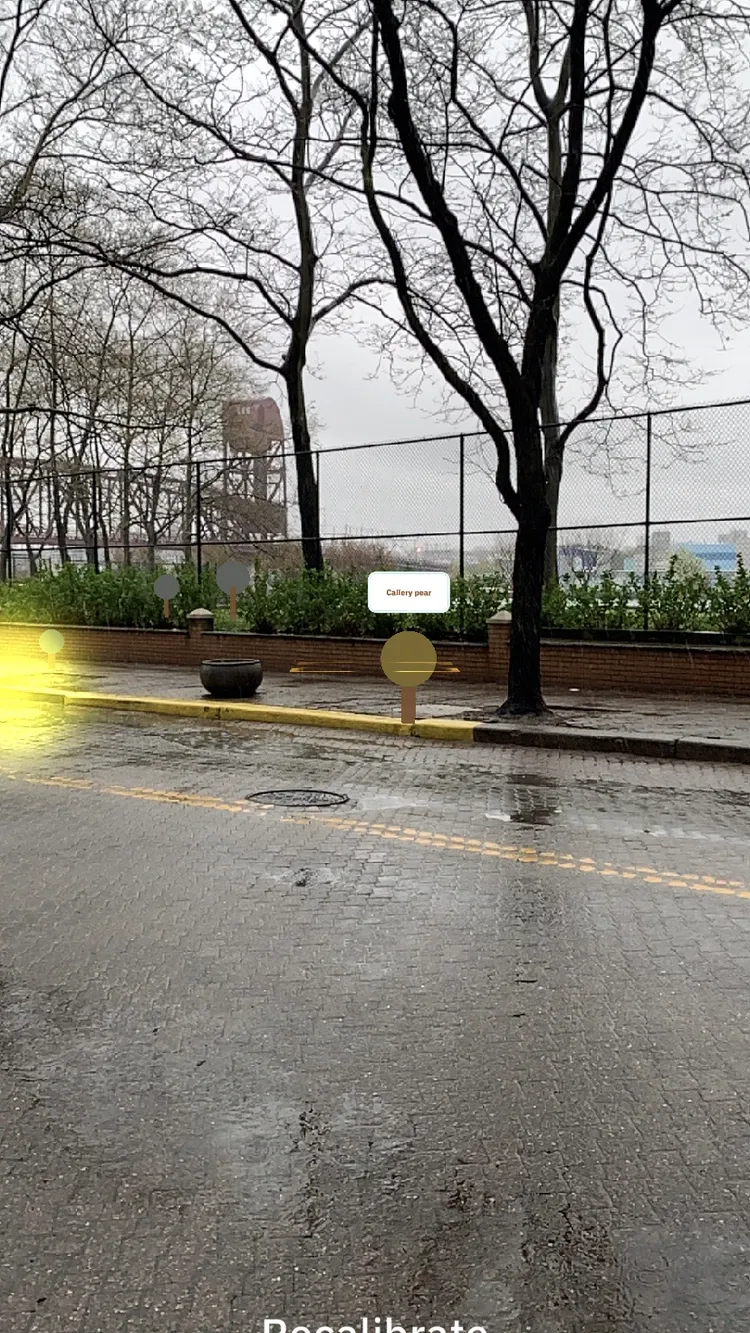
High-fidelity prototypes brought together the geospatial data layers, infographic panels, and narrative text into a cohesive mobile experience; designed to work in both screen-based and mixed reality contexts.
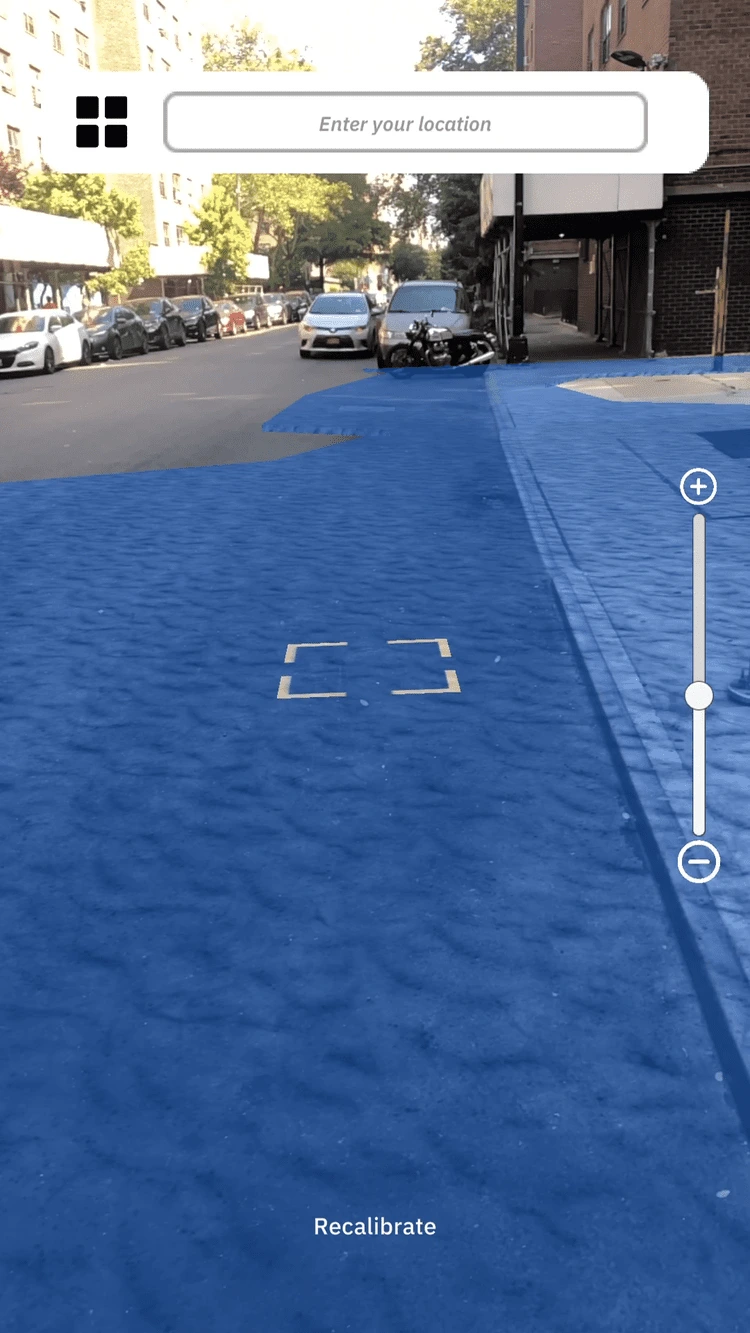
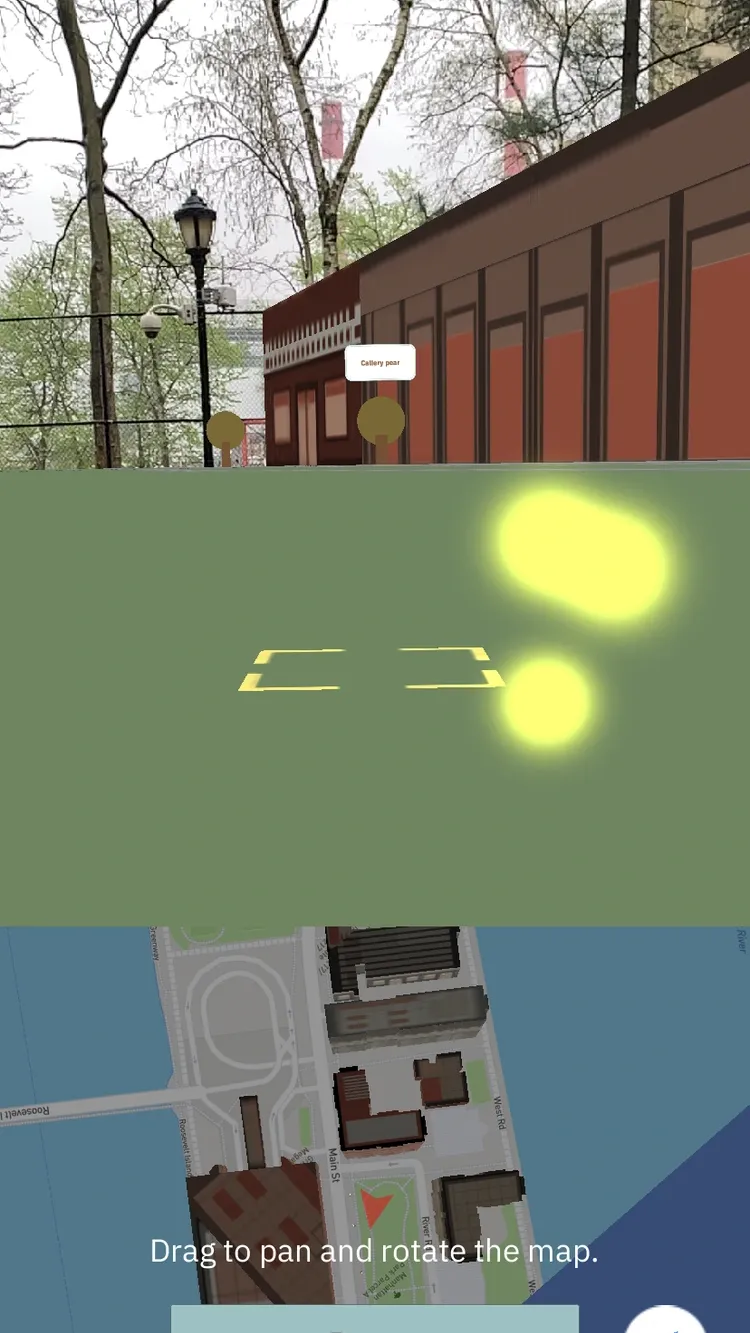

The Ocellus Platform
The final platform brings together interactive geospatial maps, data-driven narratives, and infographics in a mixed reality environment; allowing users to explore climate equity in NYC at the neighborhood level and understand the intersecting layers of exposure, vulnerability, and investment.
View Live Project ↗